Cell Annotation
After completing the Basic Analysis module for the project you created, proceed to the “Cell Annotation” module. This module presents the dimensionality reduction plots before and after annotation, cluster differential gene lists, and visualizations of top genes. It supports automatic annotation (the SingleR algorithm) and manual annotation for multiple clustering results.
Theoretical Foundations
1. What Is Cell Annotation?
Cell annotation assigns a biological identity (cell type) to each cell or cluster based on single-cell gene expression profiles. The process relies on known marker genes—genes that are highly expressed in specific cell types.
2. Core Principles of Cell Annotation
NOTE
- Specificity: Ideal marker genes should be highly expressed only in the target cell type and absent or low in others.
- Coverage: Marker genes should be consistently expressed across most cells within the target type.
- Hierarchy: Cell identities are hierarchical. For example, immune cells (major clusters) can be subdivided into T cells, B cells, macrophages, and more. Annotation should move from broad to fine-grained levels.
- Multiple Lines of Evidence: Never rely on a single marker gene. Combine the expression patterns of multiple genes, functional enrichment analyses, and reference databases for a comprehensive judgment.
3. Major-Lineage vs. Subcluster Annotation
- Major-lineage annotation identifies the main cellular lineages—such as immune, epithelial, or stromal cells—to provide a high-level overview of the dataset.
- Subcluster annotation further distinguishes finer subsets within an established major lineage, such as separating CD4+ T cells, CD8+ T cells, and regulatory T cells within the T-cell cluster. This is crucial for exploring cellular heterogeneity and function in depth.
Interface Overview
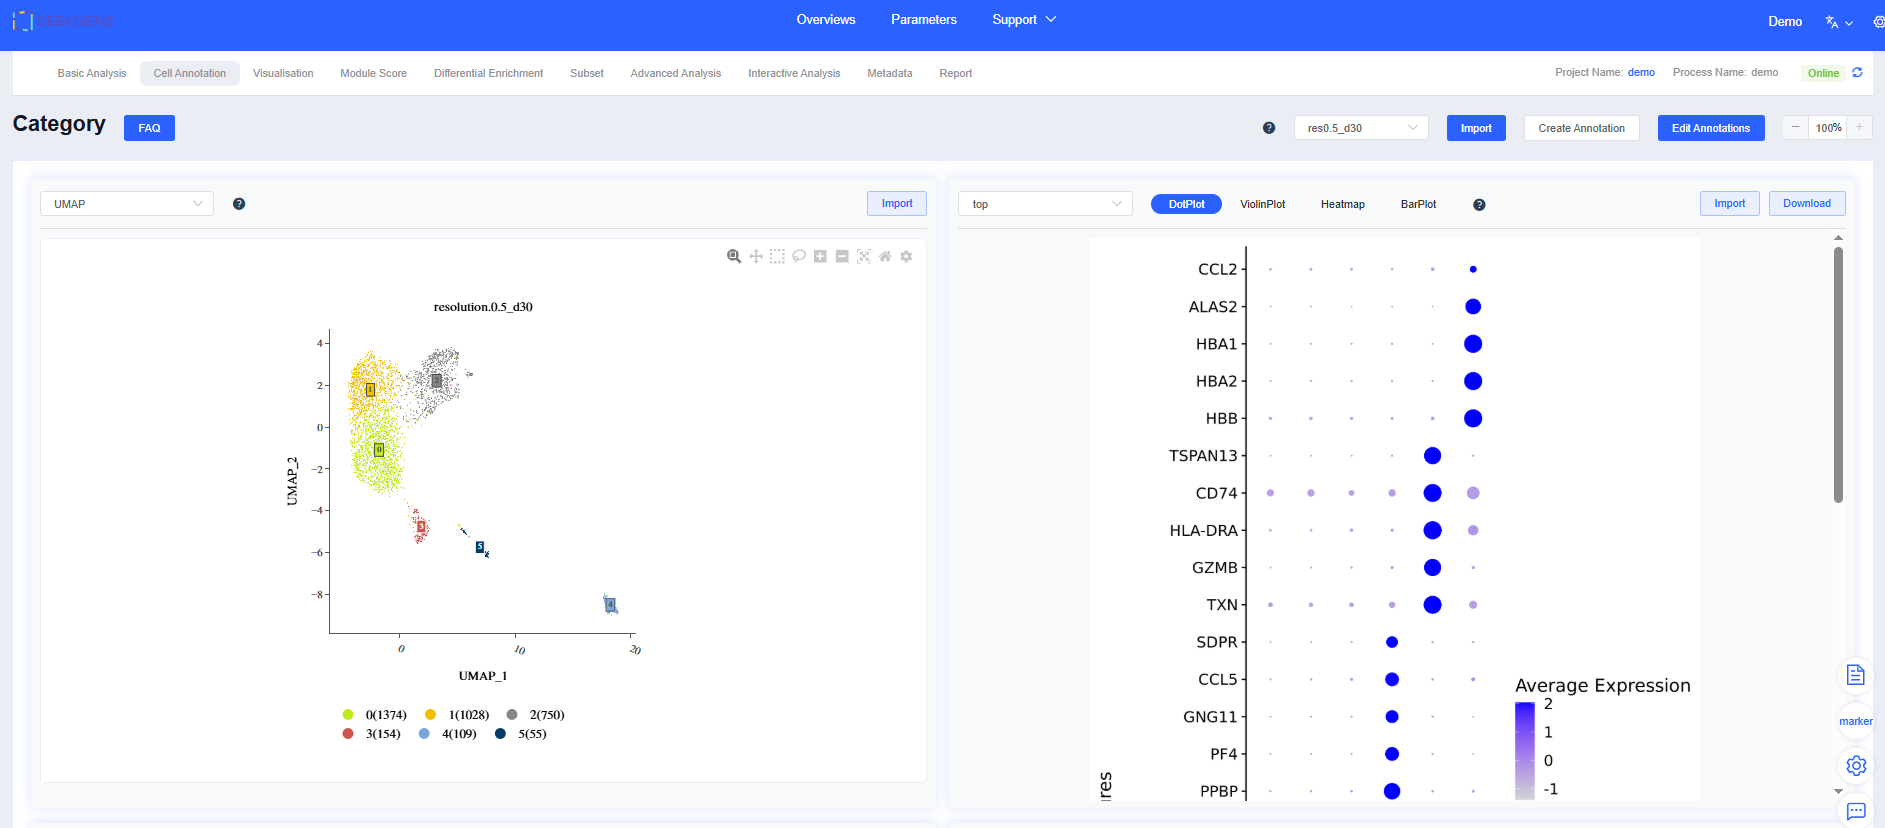
The “Cell Annotation” module comprises four major sections: dimensionality reduction results, visualizations of top genes or user-defined gene sets, the cluster differential gene list, and the expression patterns of those genes. Selecting a dimensionality reduction result updates all related panels.
- Interactive dimensionality-reduction plots: Both UMAP and t-SNE layouts are available. The plots are interactive, allowing you to reposition cluster labels and inspect cell counts with the mouse.
- Differential gene visualization panel: Every time you update clustering or annotation results, the system recalculates differential genes for each cluster and visualizes the top 5 genes (sorted by decreasing logFC) using bubble plots, violin plots, heatmaps, and bar charts that show each sample’s cell composition.
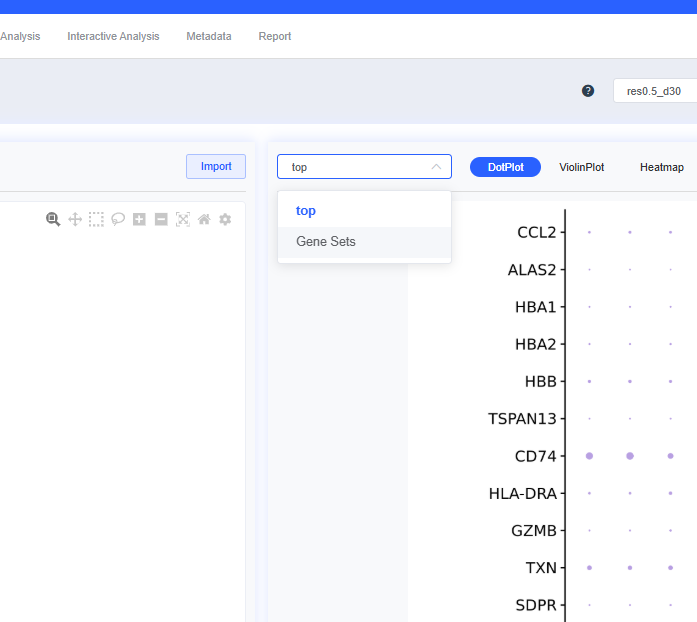
- Custom top gene sets: You can adjust which genes are displayed. Click top to open a dialog, select or deselect genes, then click Confirm to redraw the plots. You can also specify gene sets for visualization: choose Gene Sets from the top dropdown to select sets from the SeekOne database, or click + next to the workflow gene set to build a custom set.
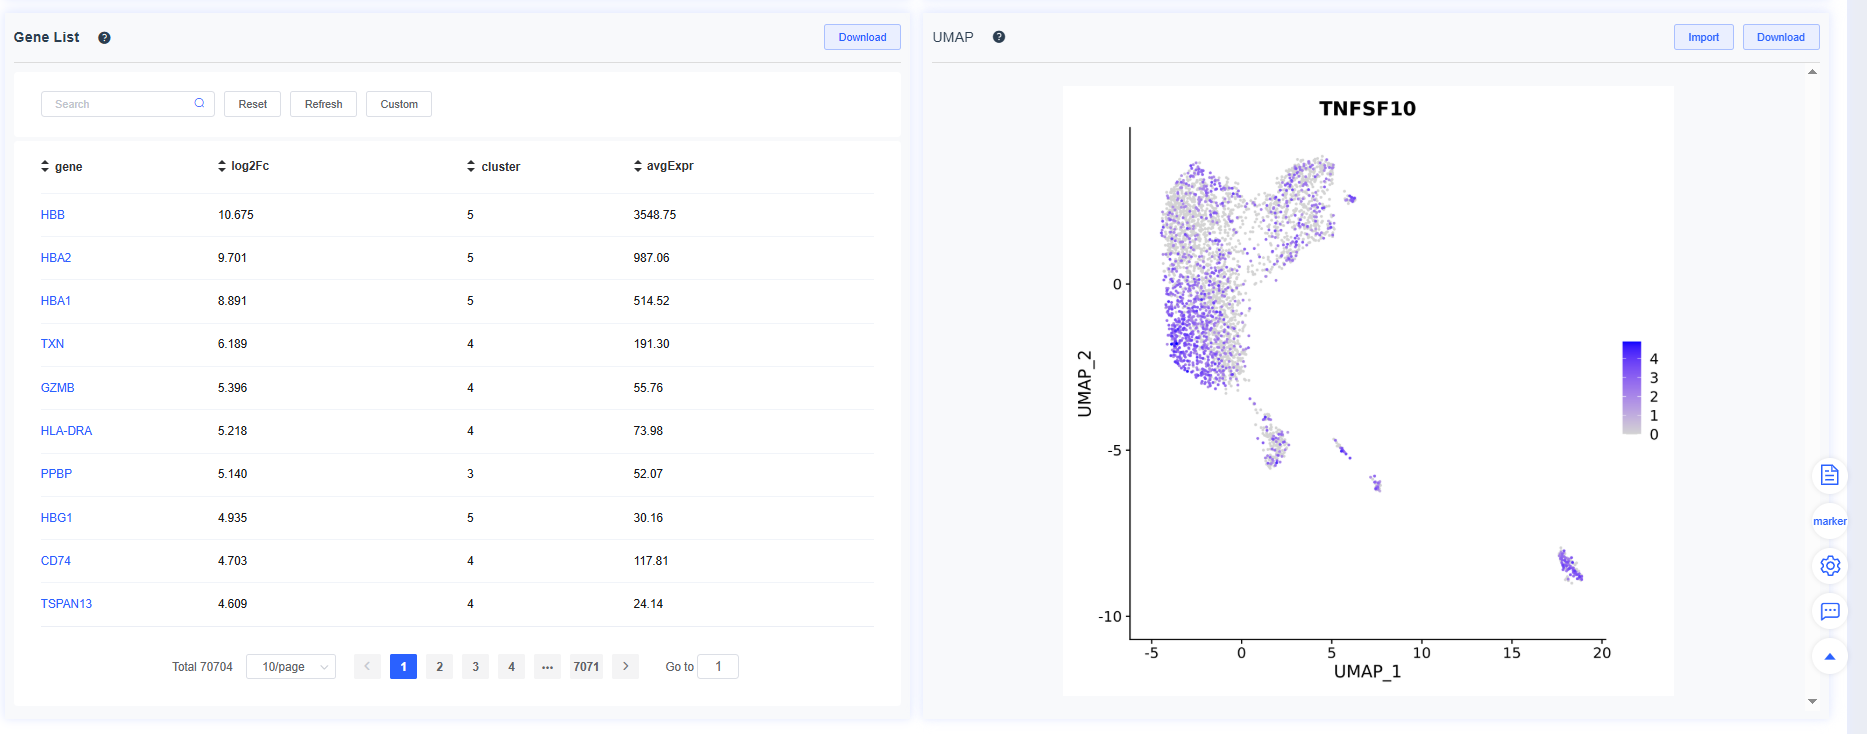
- Differential gene list: The table records the logFC of every gene for a given cluster or grouping relative to other cells. Click a gene name to open its NCBI entry, or click a row to render the gene’s FeaturePlot on the right. The table is sorted by logFC (descending) by default; use the header to customize sorting.
TIP
Every analysis figure—UMAPs, heatmaps, and more—can be shared directly to the Report page for centralized review, export, and reporting.
Annotation Strategies
The goal of cell annotation is to identify the true biological identity of each cell or cluster based on its gene expression profile. Mainstream strategies fall into two categories:
1. Marker-based Annotation
This classic, expertise-driven approach determines cluster identities using known marker lists.
- Advantages:
- Highly interpretable: Conclusions are grounded in established biological markers.
- Flexible: Marker lists can be customized for specific research scenarios.
- Can discover novel cell types: Essential for identifying unknown populations absent from reference databases.
- Limitations:
- Subjective: Heavily depends on the researcher’s prior knowledge, leading to potential variability.
- Knowledge constrained: Reliable markers may be unavailable for poorly studied tissues or organisms.
- Time-consuming: Requires manual inspection of numerous gene expression patterns.
2. Reference-based Annotation
This approach compares query single-cell data against an annotated, high-quality reference atlas and assigns identities based on similarity.
- Advantages:
- Objective and automated: Minimizes manual intervention and improves reproducibility.
- Efficient: Quickly generates preliminary annotations for large datasets.
- Limitations:
- Dependent on reference quality: Inaccurate or incomplete atlases lead to misannotation.
- Unable to detect novel types: Restricted to cell types already present in the reference.
IMPORTANT
In practice, combine both approaches. Use automatic annotation (e.g., the built-in SingleR workflow) for a fast, objective baseline, then validate and refine the results manually with known markers. This balances efficiency and accuracy.
Hands-on Guide
Automatic Annotation
The “Cell Annotation” module supports both automatic and manual workflows. After completing Basic Analysis, the system performs automatic annotation at the minimum resolution using SingleR with its reference datasets (HumanPrimaryCellAtlasData_main for human; ref_Mouse_all for mouse and rat). The automatic results are stored under the label CellAnnotation.
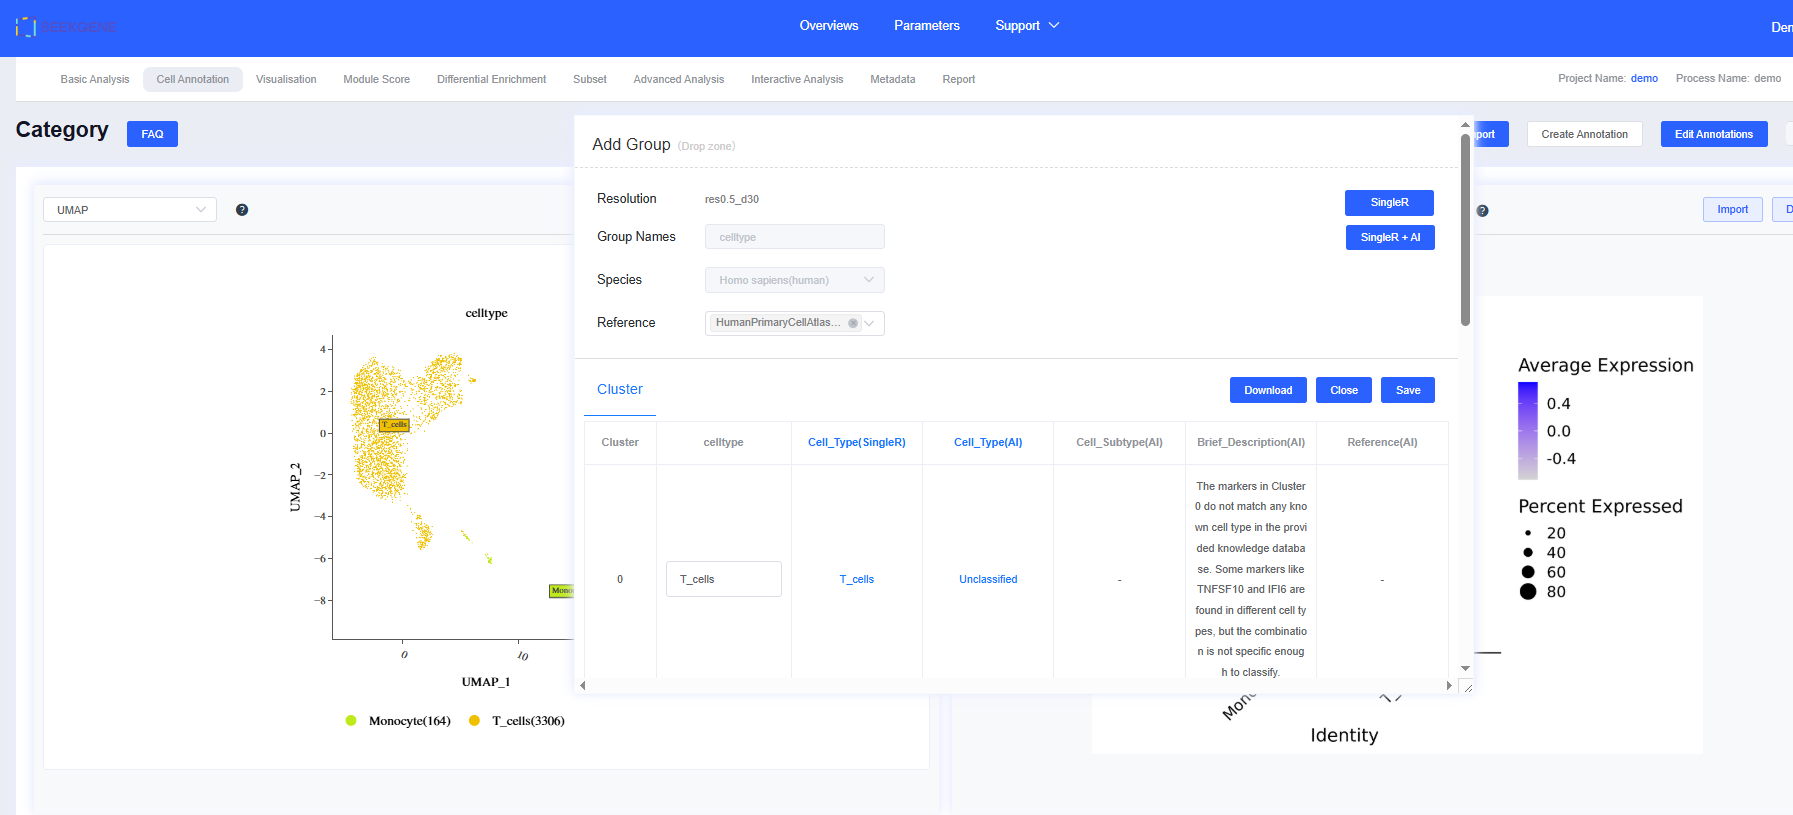
- Choose the resolution for automatic annotation from the dropdown, then click Create Annotation. A movable, resizable dialog appears.
- Enter a Group Names, select an Automatic Annotation Reference, and click SingleR. Progress updates in real time.
- When the analysis finishes, results populate the group detail table automatically. Dimensionality reduction plots, top-gene visualizations, and gene lists update in sync. Click Close to dismiss the dialog.
- Click the annotation tabs created under the same resolution to switch between results.
- Selecting Single + AI Annotation returns both SingleR and AI-generated labels, along with marker descriptions and literature references.
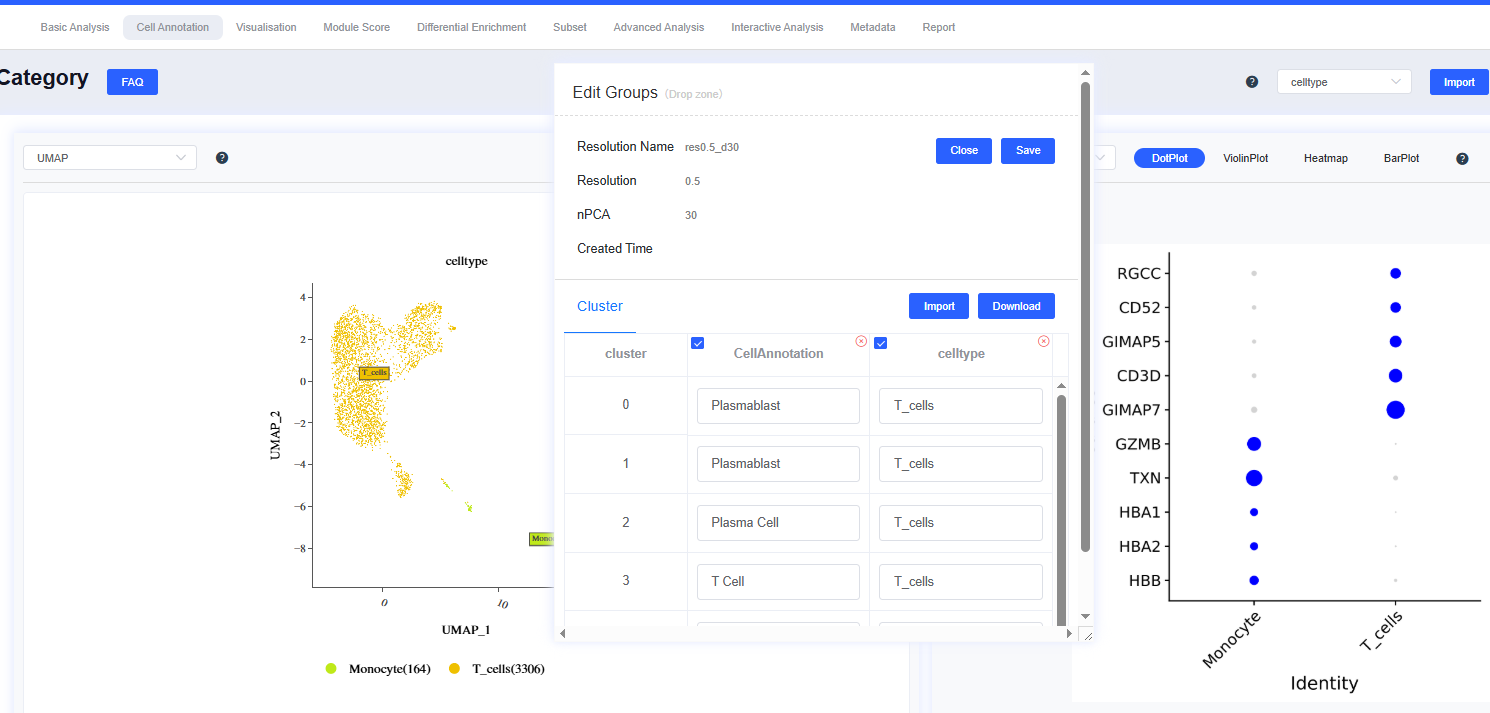
Manual Annotation
Manual annotation is vital for ensuring accuracy. Use it whenever differential expression or marker expression patterns suggest that cluster labels should be added or revised.
- Pick the resolution for manual annotation, then click Create Annotation to open the draggable, resizable dialog.
- Provide a Group Name and enter the cell type for each cluster in the group details.
- After completing all cluster labels, click Save. A progress bar appears; once finished, click Close.
- Use the annotation tabs under the chosen resolution to switch between results.
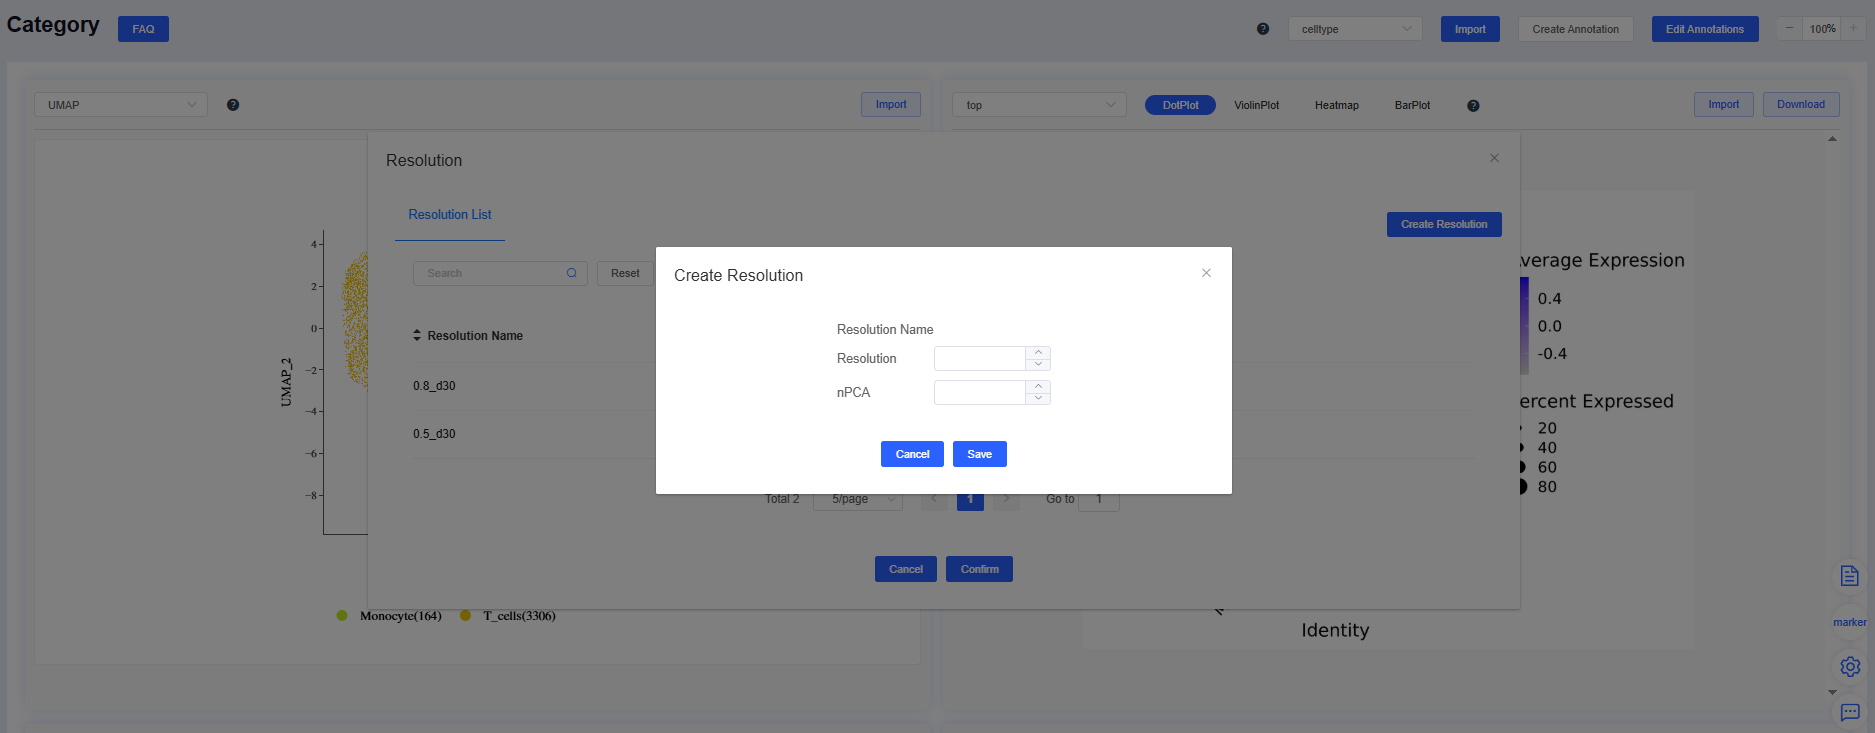
- To create a new resolution:
- Click Edit Annotations in the cell grouping panel to open the resolution window. Press Create Resolutions next to the resolution list, supply the Resolution and number of PCs (nPCA), then click Save to re-run clustering. The new results appear in both the dropdown and the resolution list.
- To edit existing results:
- In the resolution window, click Edit Annotations beside the resolution to modify its annotations. If no annotations exist, the system alerts you that no group is available. Click Delete to remove the resolution and its annotations.
- To save annotation results:
- Click Edit to open the edit dialog. The group details include all cluster labels for that resolution. Adjust as needed and press Save to sync the results. Click x to delete the annotation group for that resolution.
TIP
You can annotate and adjust the same dimensionality reduction result multiple times to compare different methods and reference datasets.
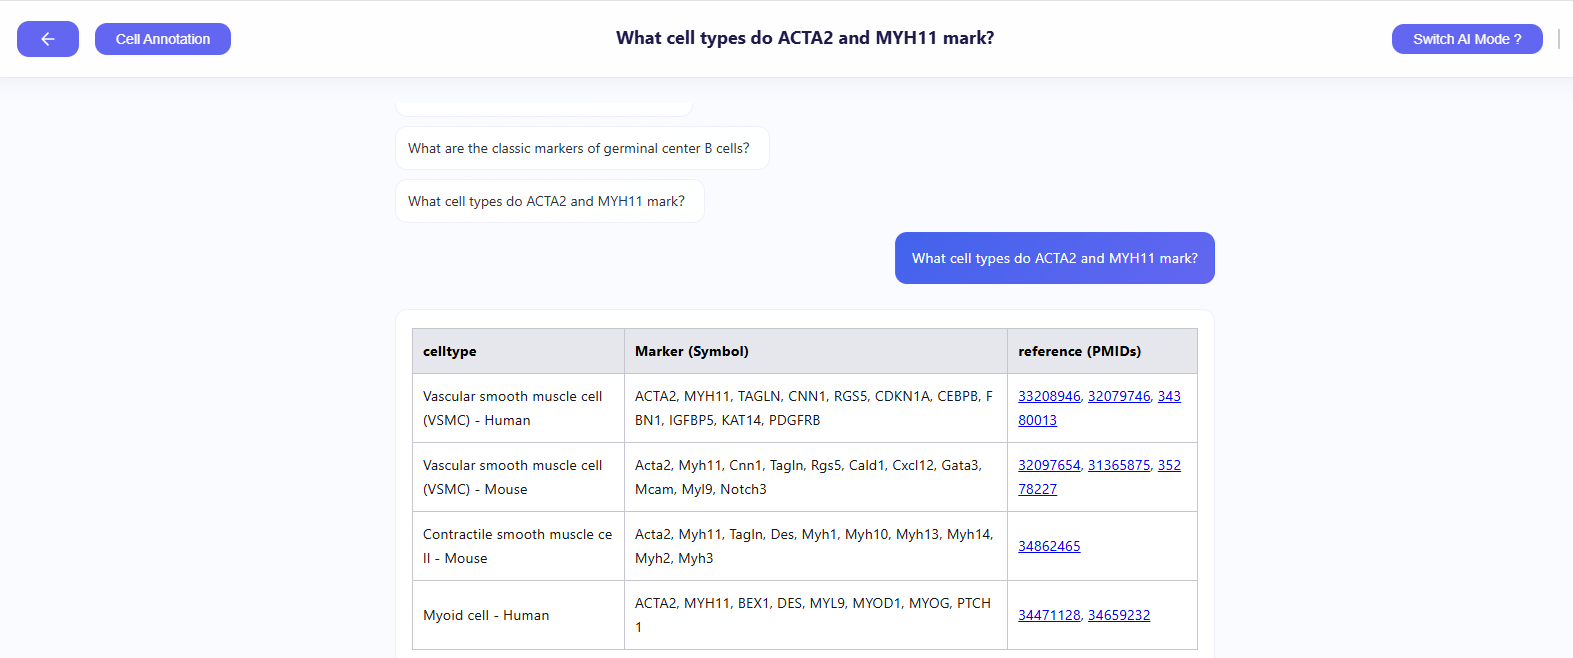
Assisted Annotation with “Xun Xiaoyin”
Manual annotation often requires prior knowledge and extensive literature review. The “Seek XiaoYin” smart assistant streamlines this process. Click Smart Consultation in the lower-right sidebar to open the assistant within the cell annotation workspace.

What is “Xun Xiaoyin”?
“Seek XiaoYin” is the platform’s built-in AI assistant. It aggregates vast biological knowledge, enabling natural-language queries to retrieve marker genes, literature references, and biological insights that accelerate annotation.
How do I use “Xun Xiaoyin”?
- Query marker genes: Ask questions such as “Which markers characterize exhausted T cells?” when you are unsure about a cluster’s identity.
- Gather supporting evidence: The assistant returns relevant marker lists and PMIDs for deeper investigation.
- Validate and annotate: Cross-check the suggested genes in the Differential Gene Visualization panel to confirm your hypothesis and finalize precise annotations.
By combining “Seek XiaoYin” with the platform’s visualization tools, you pair AI-driven convenience with the rigor of manual review, significantly boosting efficiency.
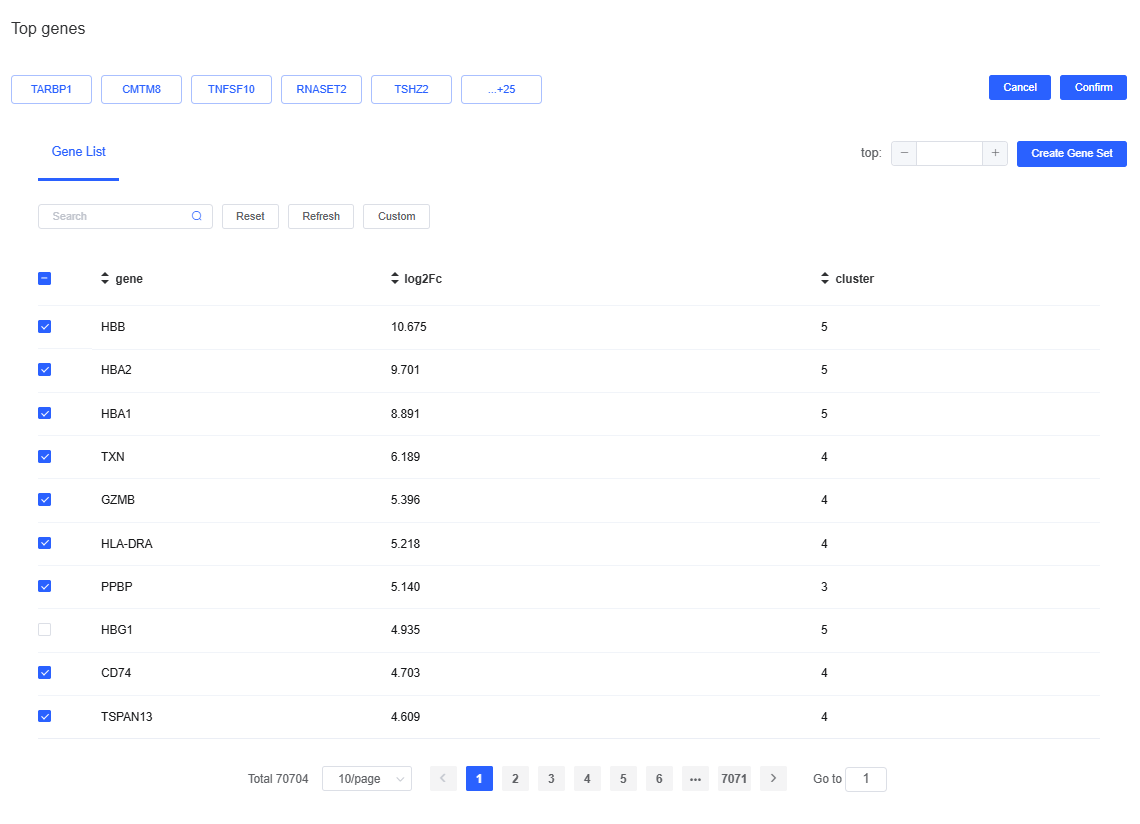
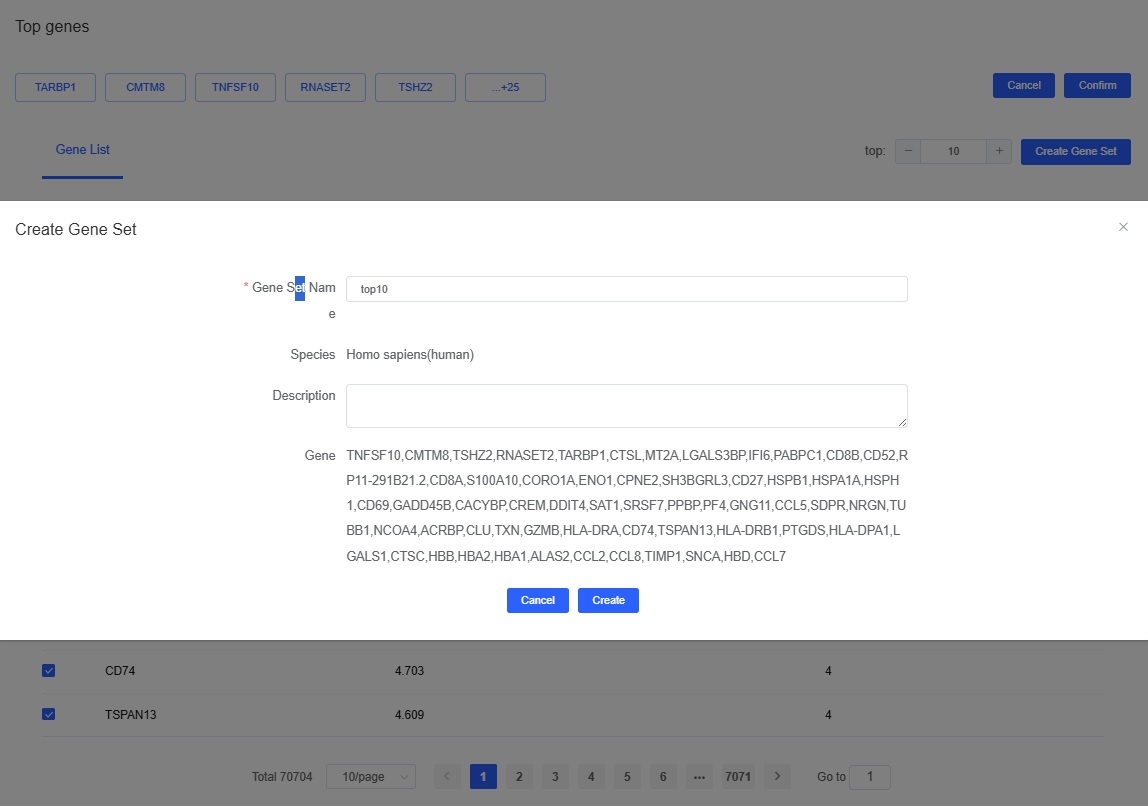
Create Top-N Gene Sets
Click top to open the top-gene dialog. Specify the number of genes (e.g., top10), click Create Gene Set, provide a name, and press Create to finish.
Notes
- Heatmaps lose labels when cell counts are too high, so they are drawn after downsampling, retaining up to 500 cells per cluster or group.
- To accelerate differential gene calculations, logFC values are computed with presto. Results may differ slightly from FindAllMarkers or FindMarkers, but the outputs remain linearly correlated.
- For special species, consult the discussion on Single-cell Annotation Methods for Special Plant and Animal Species.
Interpreting the Results
Evaluate a high-quality annotation using the following criteria:
- Consistency in dimensionality-reduction plots: Do cells of the same type cluster together on UMAP/t-SNE plots? Are boundaries between types clear? Blurred edges can signal intrinsically similar transcriptomes or a need to tune clustering parameters.
- Marker specificity: Inspect heatmaps, violin plots, and FeaturePlots to confirm that key markers show the expected expression. For example,
CD4should light up only in CD4+ T cells. - Reasonable cell proportions: Verify that cell-type proportions match the biological context—for instance, lymphocytes (T, B, NK cells) dominate healthy peripheral blood.
- Coherent biological narrative: Ensure the final annotations tell a consistent story. A tumor sample should include tumor, immune, and stromal cells to reflect the basic tumor microenvironment.
Example: Annotating T-cell Subsets in the Tumor Microenvironment
- Background: In single-cell RNA-seq data from lung cancer tissue, major-lineage annotation has already identified a T-cell population.
- Objective: Dive deeper into T-cell heterogeneity to discover subsets that may affect immunotherapy outcomes.
- Method: Perform subcluster annotation on the T-cell group using classic markers (
CD4,CD8A,FOXP3,PDCD1(PD-1),CTLA4). - Findings and interpretation: Multiple T-cell subsets emerge, including a CD8+ T-cell population co-expressing
PDCD1andCTLA4. This indicates a functionally exhausted subgroup that could contribute to suboptimal immunotherapy responses, guiding subsequent investigations.